Find out how to use LINZ Data Service (LDS) and get the information you need from it.
Register
Find out how to register for the LDS
Browse or search our data
You do not need to sign in or register to explore our data.
Search, browse or scroll for the data you want using either:
- The left-hand panel of the screen – click the browse data button or you can type keywords into the search box.
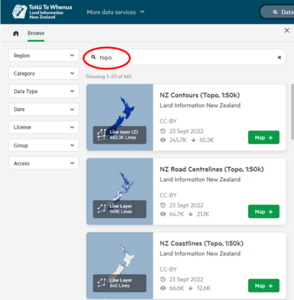
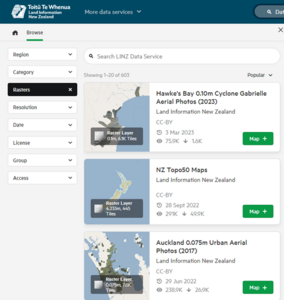
- Use the drop down lists on the left to filter the results.
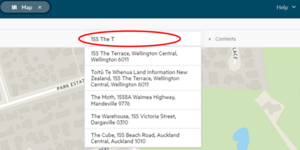
- In the right-hand panel of the screen featuring a map of New Zealand – type in addresses or place names in the search box over the map. You will see location options. Click on the address you want. The map will jump to that location.
Favourite
- From the Favourite pane, datasets that have been starred will appear. This is useful for frequently accessed datasets.
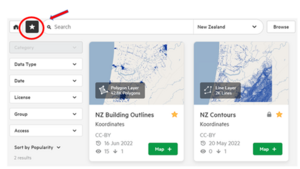
- To add or remove a dataset from your favourite list, click the star next to its title on the data card.

Create a shortcut link to a map view
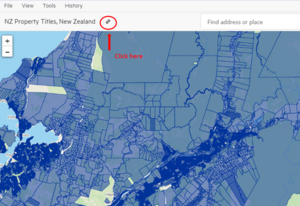
The 'link' icon next above the Map Viewer creates a URL to a map view or a feature that can be bookmarked or shared with others.
- Add the datasets using the green 'Map +' button.
- Zoom in or search for an address.
- Crop a section (if you wish).
- Click on the link icon above the Map Viewer.
- A pop-up box appears at the bottom right corner notifying user that the link is copied to the clipboard.
Explore our data
We provide data in 3 types: vector, raster and tabular.
Vector data
Vector data relates to position and has one or more coordinates. There are 3 kinds of vector data:
- polygons: data made up of a closed sequence of lines, shapes, that represent areas like lakes, patches of native bush, parcel boundaries
- lines: data that represents linear features, like roads, rivers and railway lines
- points: data that represents discrete features where each point has an X and Y (and sometimes a Z) location. Railway stations, historic sites and geodetic marks are some examples.
Raster data
Raster data represents surfaces, like imagery and maps.
Our raster data is geo-referenced, which means we divide our maps into cells and give each cell a coordinate so that we can determine its location.
Tabular data
Tabular or aspatial data is data in a table format that does not relate to position.
Metadata
Metadata is information about the data that includes:
- the dataset title
- the geographic coverage
- version
- maintenance
- the creator and their contact details.
Other information about our data you can view
- Data Table: available for vector and raster data only. Scroll through a table of the raw data. Use the ‘Search in data’ tool to search for specific attributes.
- Tiles Table: available for raster data only. Enables you to download individual raster tiles in it’s native format.
- History: a record of all revisions and changes to the dataset.
- Services: URLs for accessing data through web services.
To view the attribute data, click inside a polygon or on a point or line on the map. The data of the feature appears in a new window.

Create and customise a map view
To create your own map view, add datasets to the map of New Zealand in the right-hand panel of the screen. For example, you can add a roads dataset to a property titles dataset for the particular area you want to see.
Working with datasets
Add a dataset
- Find the dataset you want.
- Click the green ‘Map +’ button under the dataset title.
- The dataset appears on the map for you to view, zoom or query.
Remove a dataset
- Click the black ‘Map X’ button, or
- Remove the dataset from the ‘Contents’ section at the top-right corner of the page.
Cropping
If you do not crop the dataset, you will receive the whole dataset when you download.
Cropping reduces the size of your download by limiting the data to the selected area. The smaller set of datasets is quicker to download and share.
Note:
Tabular datasets cannot be cropped.
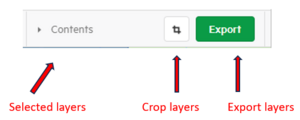
To crop, click the ‘Crop’ button next to the ‘Export’ button. Choose ‘Crop by rectangle’ or ‘Crop by region’.
Crop by rectangle
The crop box will appear after hitting the crop button, which is set to ‘Crop by Rectangle’ by default.
- A black outlined box will show the area you are cropping to.
- You can adjust the edges of the crop box to refine the area that will be cropped.
To cancel the crop, click on the ‘Crop’ button again or the ‘Redrawn’ crop link in the crop window.
Crop by region
Use region crop to clip and download any dataset by geographical area.
- Choose the area breakdown from the ‘Region type’ drop down menu:
- Toitū Te Whenua map sheets (Topo, 1:250,000)
- Topo50 map sheets
- General electorate boundaries
- Māori electorate boundaries
- Territorial authorities
- Regional councils
- North Island, South Island, and Chatham Islands
- Choose your selected area from the ‘Region’ drop down menu.
- A border shows the region you have selected.

Note:
The crop you see marked on the screen is a simplified display. The file you download will be cropped to the exact area – full geometry – of the region.
Use the top navigation for screen layout controls and further help:
- find more data services from Toitū Te Whenua

- turn the Data Browser or Map Viewer on or off

- access Help documentation and licensing information.

Understanding Toitū Te Whenua data
Find out about the types, origin and best-fit uses of data available through the LINZ Data Service.
Origins of our data
The data published on LDS is the same data used by Toitū Te Whenua in our day-to-day business. Most of it is published in a very similar form to that stored and used in our own systems.
This means we may publish multiple datasets with similar names, but from different sources and with very different purposes. An example of this is the NZ Road Centrelines (Topo, 1:250,000), NZ Roads (Addressing), and NZ Primary Road Parcels.
Information about Toitū Te Whenua data
The metadata attached to each dataset provides comprehensive information about the data. This covers data purpose and source, lineage, currency, completeness and accuracy.
Purpose
The original purpose of our data can affect the way it should best be used. For example, the purpose of the data in the NZ Road Centrelines (Topo, 1:50,000) layer, like all our topographic vector data, is to provide the raw information that is used in the production of our Topo map products, specifically our printed paper maps. This means the data has been designed for readability on a map and so could safely be used in a mapping application. However it is not suitable for route planning where extra information like speed limits and turn restrictions are important.
NZ Road Centrelines (Topo, 1:50,000) dataset
Source
Source is the system or database the data comes from. It can impact the format and coordinate system of the data published on LDS.
For example, data in the property ownership and boundaries category on LDS is published in UTF-8 format as this is required by the source Landonline database to allow for the entry of special characters, such as macrons in Māori place names.
Lineage
Lineage is the data lifecycle, the origins of the data, processes applied to it and changes over time. Lineage can be helpful to understanding aspects of data completeness, quality and accuracy.
For example, for many years, information about property boundaries was stored in paper survey plans, searchable via a series of index maps of the individual land parcels. These index maps were digitised in the late 1980s, with accuracy only as good as the original scale paper maps. This is why some parcels have lower levels of accuracy.
A similar digitisation process took place for title (ownership) records, where only the ‘current’ record was digitised. This is why LDS does not contain the majority of the historic title information - those records that were historic prior to the time of digitisation (about 2001).
Currency
Datasets are updated at different intervals. Currency is important for data that changes frequently, such as data about the transfer of property ownership (titles).
Property ownership and boundaries and street address data is published on LDS weekly, topographic data every 2 to 3 months, and hydrographic data only every 6 months. Each layer on LDS displays a last updated date under the About tab.
Completeness
Some datasets published on LDS are incomplete or do not have national coverage. Sometimes this incompleteness is historical (for example, data was not captured at the time), or it is simply not required for the purpose of the dataset.
For example, the NZ Fence Centrelines (Topo, 1:50,000) dataset only contains data for a selection of fences, enough to indicate general land use on the printed Topo50 mapsheets.
Accuracy
Accuracy is impacted by factors like system or technology constraints, changes over time to data collection, and standards and regulations.
For example, the level of accuracy needed for Topo50 data, used for making paper maps, is different than for survey boundary data used for property rights and restrictions.
Accuracy can also vary within a dataset. For example, due to density of urban areas and data improvements, property boundary data, such as the NZ Primary Parcels layer, is more precise in urban than rural areas. The NZ Survey Boundary Marks layer provides further information on parcel accuracy.
Where to find more comprehensive information
Resources for better understanding Toitū Te Whenua data:
- Read the summary description for the dataset on its data card in LDS, such as NZ Contours (Topo, 1:50,000) – this summary includes information on data accuracy and links to additional resources
- Read the metadata for a dataset on LDS, especially the lineage statement such as NZ Property Titles metadata
- For high level descriptive information about the data we publish through LDS. View the Data section on the LDS website
- View a sample of data under the Info tab.

- Where available, familiarise yourself with the data dictionary for the dataset you’re interested in:
o Property and Ownership Simplified tables
o Address data
o Road (Addressing) data
o Topographic data
o Hydrographic data (provided via the official S-57 catalogue)
o Full Landonline dataset
Get your data through download or courier
You need to register with LDS to download data.
Download your data
You can download data up to a size of 15GB. If your file is larger, you need:
- to order courier delivery of the data or
- crop the data to download only the area you’re interested in (rather than downloading the whole dataset)
- select fewer datasets at one time.
Step 1: Sign in
Enter your username (your email addres) and the password you provided when registering.
Step 2: Begin the download process
Click the ‘Export’ button on the top menu bar above the map.

Step 3: Choose a download format
In the new window showing format and projection you have a choice of download formats.
- For Vector GIS, the best format is generally Esri File Geodatabase, Esri shapefile, MapInfo TAB format, GeoPackage/SQLite or CSV / WKT format.
- For Raster GIS, we recommend GeoTIFF or JPEG format.
- For CAD, use DWG format.
- For Google Earth, use KML format.
- For graphic design or print, use PDF format.
Find out more about LDS export formats
Step 4: Choose a projection
Projections are tools that adjust data to account for the distortions that occur when translating from a curved surface (the globe) to a flat perspective (a map).
- For property and topographic data, use Transverse Mercator 2000 (NZTM)
- For hydrographic data, use World Geodetic System (WGS84)
- For data spanning New Zealand’s mainland and offshore islands, use New Zealand Geodetic Datum (NZGD2000)
Find out more about projections.
Step 5: Create the export
By clicking 'Create Export', you are agreeing to the Terms of Use. It is your responsibility to respect any copyright and licensing terms that may apply.
Click the ‘Create Export’ button. LDS will begin creating your download file. This file will be a zip file containing:
- the data you requested,
- metadata records,
- any related documents and
- a contents file summarising your order along with a copy of the licence or agreement setting out the terms and conditions under which the data can be used.
To download the file click the green highlighted button. Open or save the file, then unzip it.
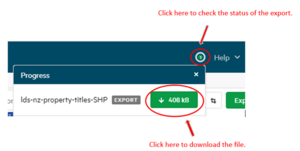
Downloading may take a few minutes.
Save data for future download
- Chose the data you want.
- Click the icon next to the Help menu to create a URL to your data.
- Save this URL to use later.

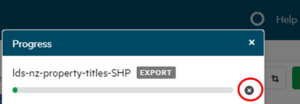
Want to stop your export?
Click on the ‘Stop’ icon next to the export progress bar.
Courier your data
We can courier your data to you if:
- you want to avoid downloading a large data file
- your download file size is over our 15GB limit.
Couriering data is charged on a base fee + media type + estimated data size + delivery country basis.
If you choose the courier option, you will see an estimated cost displayed in the download window.
Courier delivery service
Koordinates Ltd manages all aspects of the courier delivery service on our behalf.
Visit Koordinates’ support website for further information and contact details.